

Rethinking Repair: Strategic Insights from the Circular Economy
At Three Horizon Advisors, we’ve had the opportunity to work across the entire device lifecycle – from OEMs and telcos to logistics providers, insurers, and TPAs, helping clients define strategies in the circular economy, evaluate repair/refurbishment markets, and develop adjacent growth opportunities.
This blog consolidates insights from our six-part LinkedIn series, drawing on our engagements across the secondary device value chain. Each section is rooted in research, client interviews, and practical experience – all pointing toward a rapidly evolving repair and refurb landscape that is becoming central to growth, sustainability, and customer strategy.
1. A $300B Market, But Only a Sliver Serviced – The Case for Strategic Expansion
The U.S. consumer electronics market surpasses $300 billion annually in wholesale revenue. Yet most repair and refurbishment vendors only address a narrow slice – typically smartphones, a portion of tablets, and select networking gear.
Smartphones alone represent over $70B in sales annually and dominate the volume in repair, supported by robust infrastructure, trade-in programs, and strong OEM alignment.
Laptops, tablets, and wearables account for another $100B+ in wholesale value, but vary widely in repairability, part standardization, and ASP.
Home networking and gateway devices (CPE) are growing quickly in importance – driven by broadband, Wi-Fi 6/6E, and 5G deployments and represent a strong mix of volume and repair simplicity.
Hearables, smart home, digital health, and auto tech remain underpenetrated by formal repair infrastructure despite growing volumes and resale potential.
The chart below illustrates how current vendor focus addresses only a sliver of the broader CE opportunity. Strategic expansion requires targeting segments where high ASP, part availability, serviceability, and resale dynamics intersect.
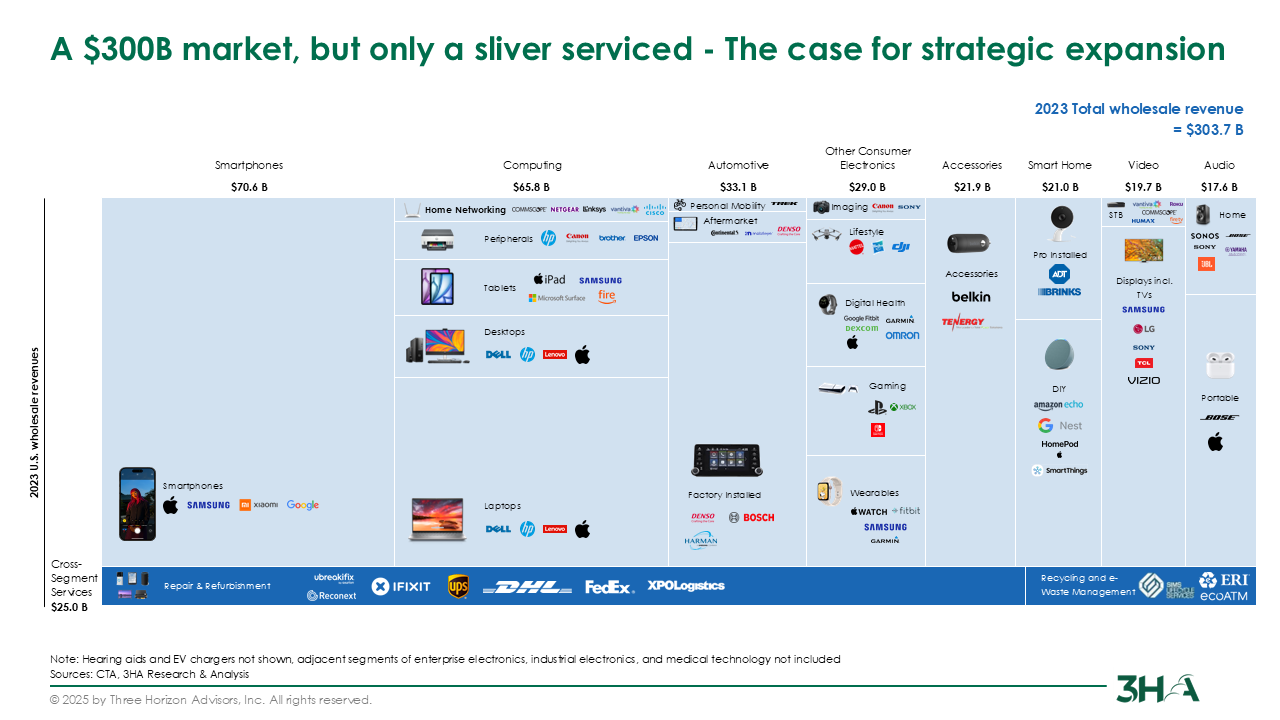
Figure 1: Electronics Category Sizing: U.S. Wholesale Market
2. What Drives Repair Economics: Volume, ASP, and Complexity
Scale in repair isn’t just about how many devices you see – it’s about how the economics stack up at the category level. At 3HA, we evaluate every product category against:
- Volume potential
- Residual value (e.g., trade-in, resale)
- Service complexity (parts availability, repairability, OEM support)
What we found:
- Smartphones lead the pack on all three dimensions
- Gateways (e.g., fiber/Wi-Fi routers) are high-volume, low-complexity, and increasingly OEM-supported
- Wearables, especially smartwatches, have attractive ASPs (~$300), short replacement cycles, and fast-growing trade-in support
- Laptops offer high value (~$600+) but are fragmented across OEMs and SKUs – making operations harder to scale
- Tablets, while similar in ASP, face issues of fragility and inconsistent parts ecosystems
Meanwhile, categories like STBs, TVs, and digital health are either too fragmented or too low in residual value to support scaled programs – at least today.
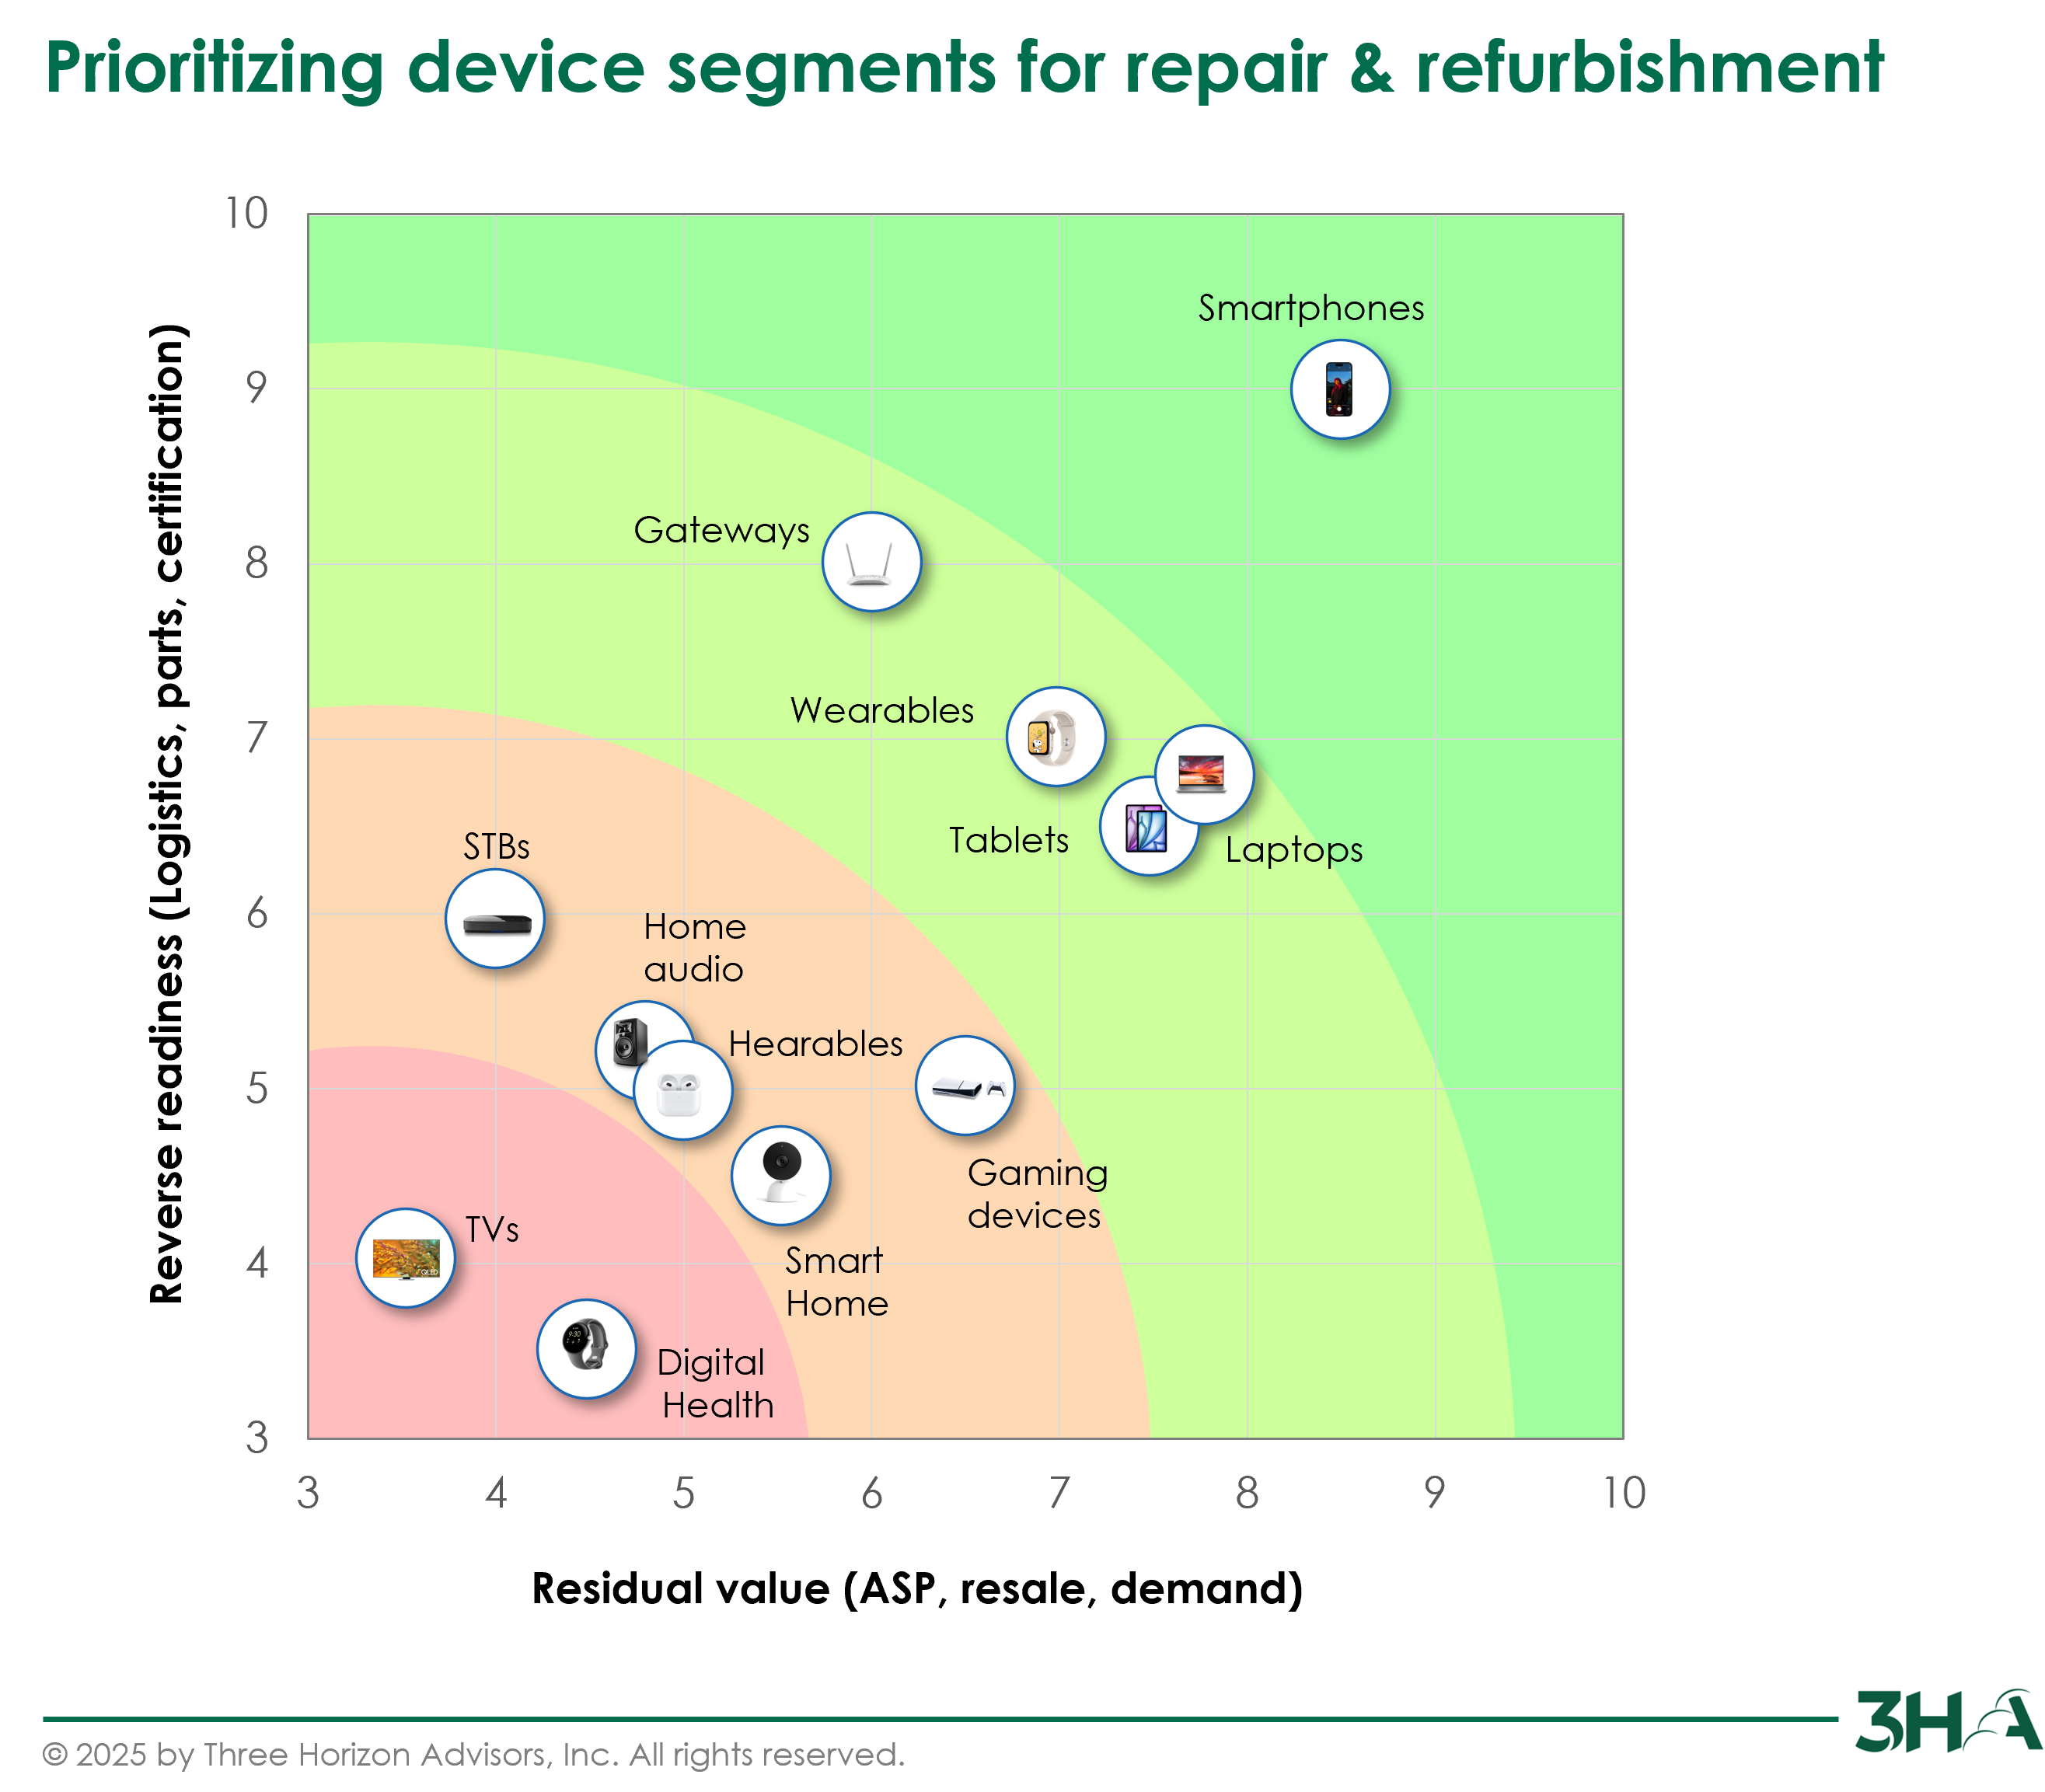
Figure 2: Repair Segment Prioritization
Related Read: State of U.S. Cable / MSO industry
3. What Repair Buyers Actually Value – And Why Nimble Vendors Win
We’ve interviewed dozens of buyers across telcos, OEMs, insurers, TPAs, and logistics providers. Their expectations go far beyond basic price and delivery — they focus on performance, integration, and transparency.
Top themes:
⚡ Speed and consistency: turnaround time, defect rates, responsiveness
🔍 Transparency and visibility: real-time tracking, repair-level analytics
🔗 System integration: APIs, ERP workflow alignment
🎯 Flexibility and service mindset: ability to handle diverse SLAs, device types, OEM certifications
📊 Diagnostic and analytic support: to reduce loss, optimize NTF (no trouble found), and improve recovery
What’s striking is that scale and name recognition rarely top the list. Instead, buyers often favor mid-size vendors who are faster, more flexible, and easier to work with.
📈 This has meaningful implications for mid-market vendors: the path to growth isn’t just scale – it’s trust, transparency, and execution.
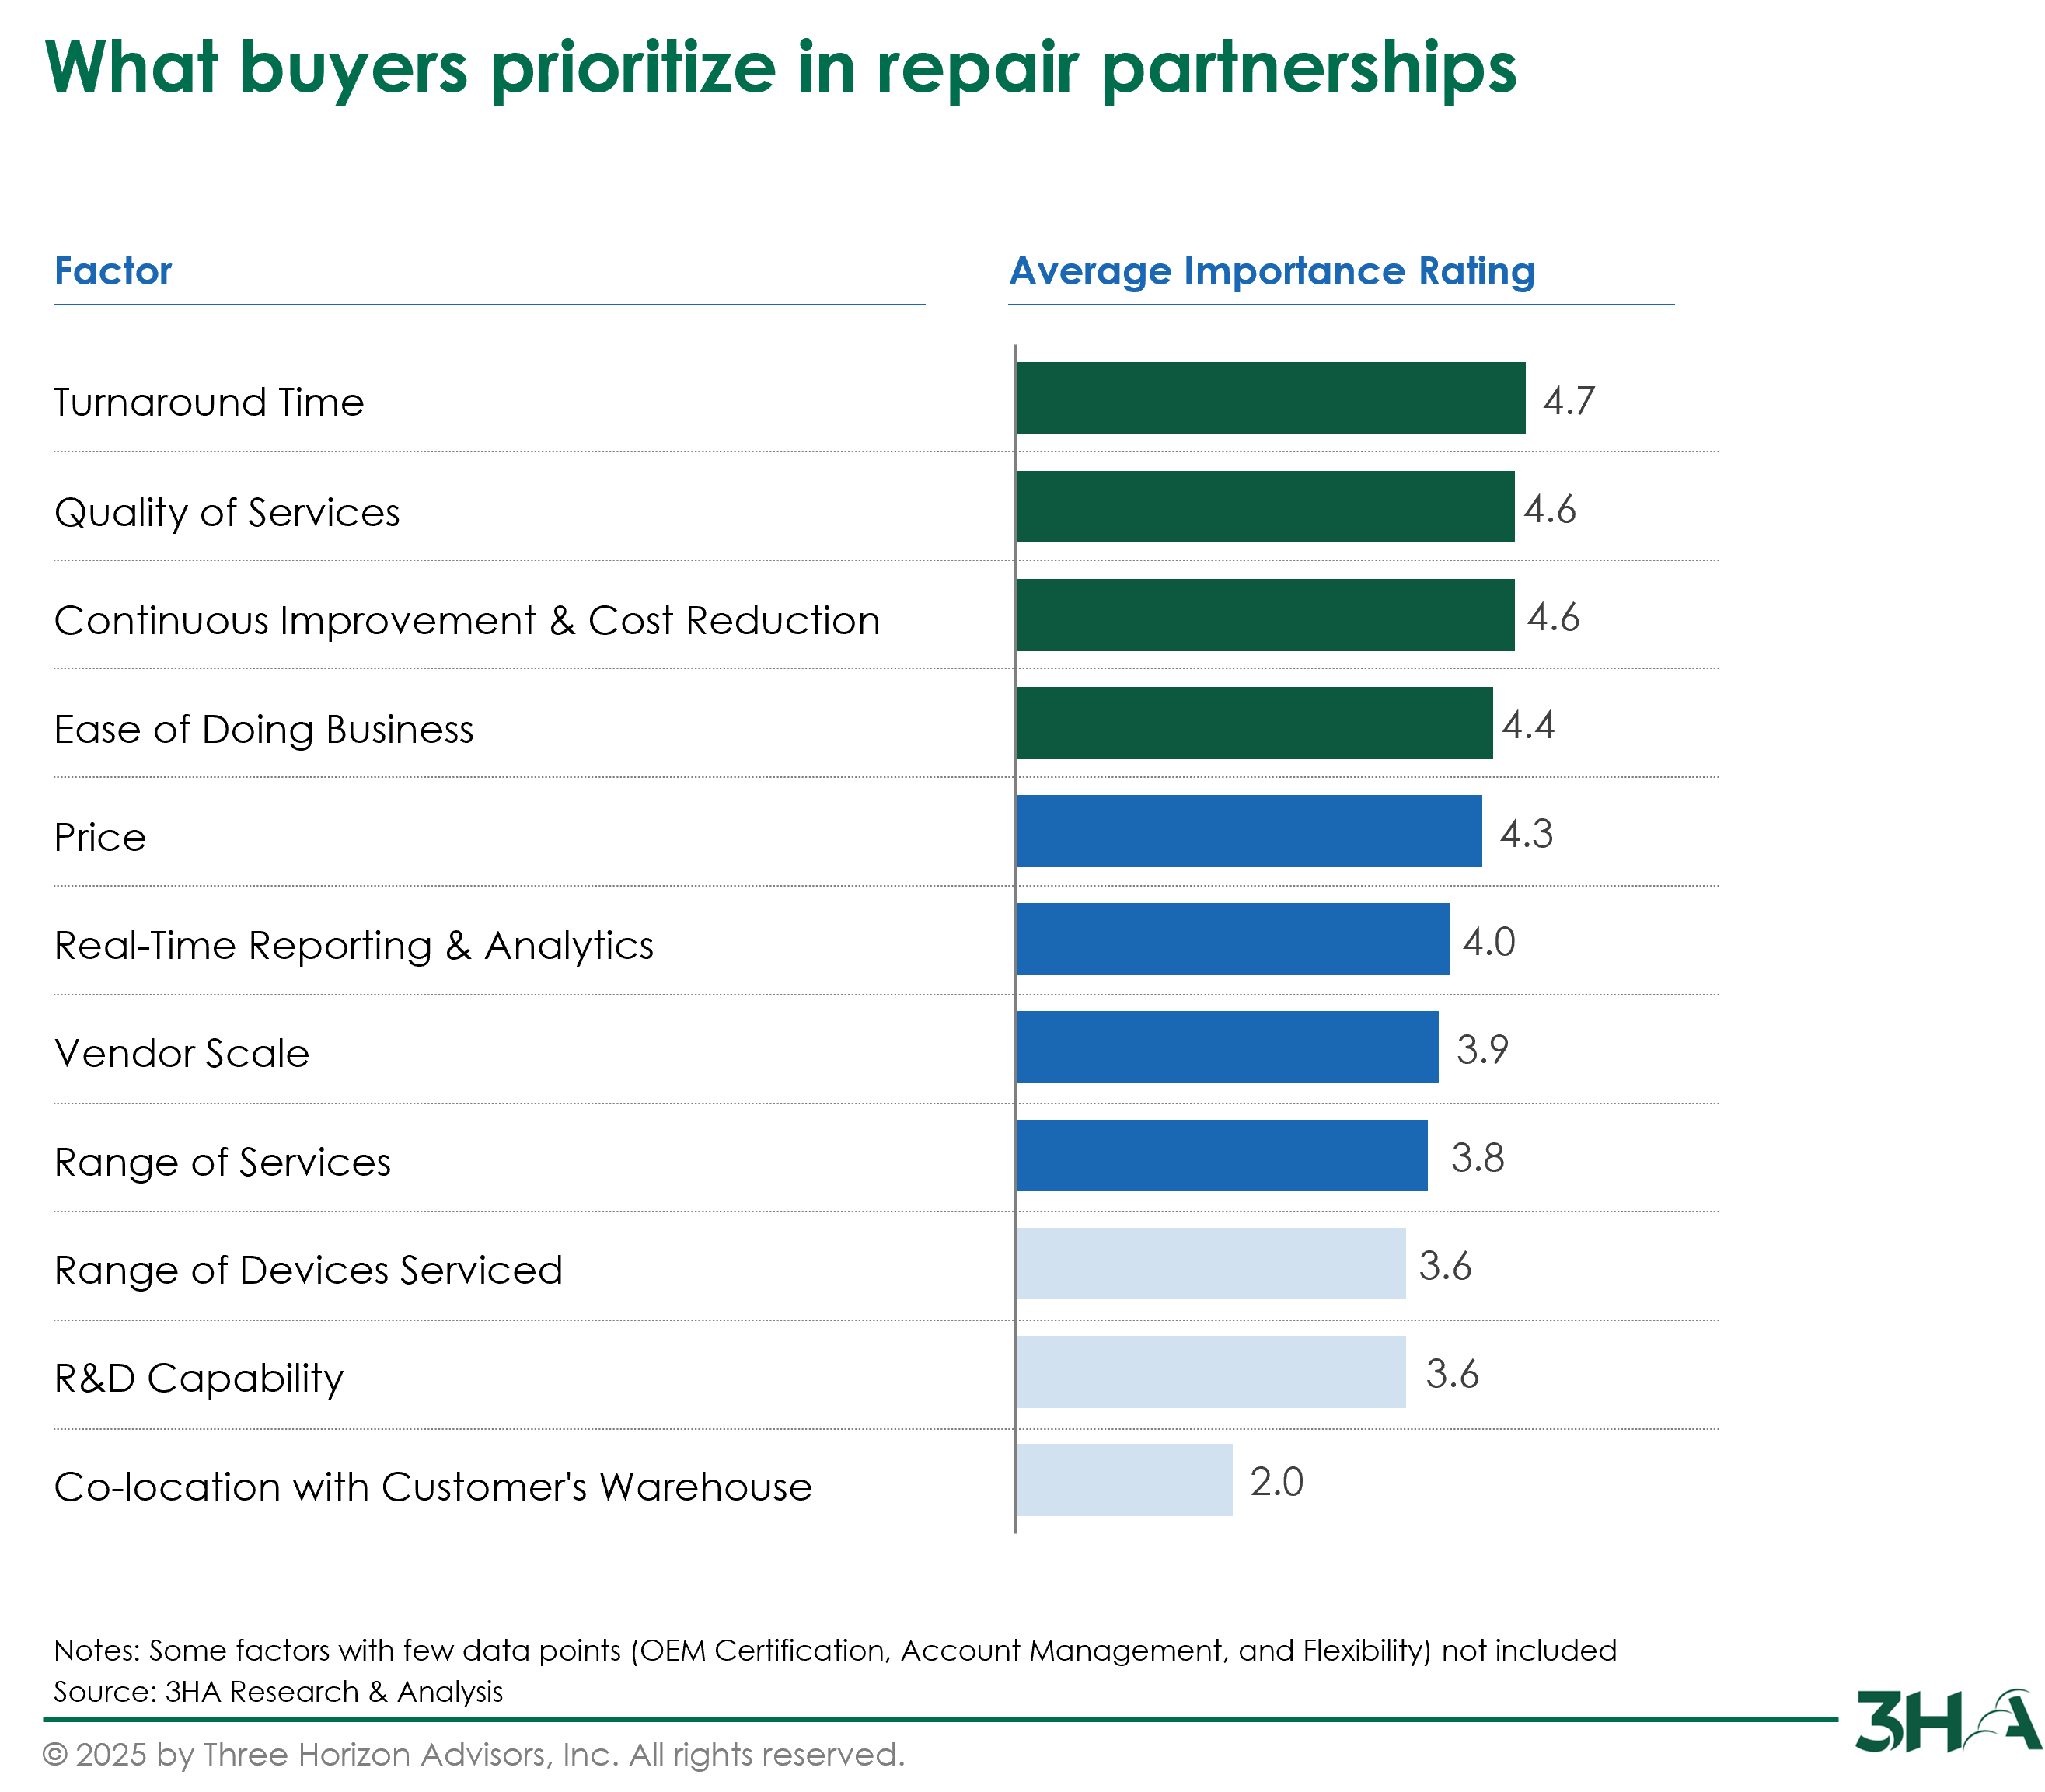
Figure 3: Repair & Refurbishment Key Purchase Criteria
4. Winning in Adjacency Expansion: The 1–2 Step Rule
Many vendors aim to grow by entering adjacent markets – but not all moves pay off. Our analysis uses a Bain-style “steps from the core” framework to evaluate adjacency success.
Key takeaways:
- Success odds decline significantly with each “step” away from the core product or service.
- Vendors that stick to 1–2 logical steps – e.g., smartphones → tablets, gateways → wearables see better outcomes.
- Expansion into unrelated categories (e.g., TVs, automotive modules) without OEM integration or service alignment adds risk.
Successful adjacency expansions share:
- Operational alignment (same tech stack or part flow)
- Customer demand pull (existing customer requesting it)
- ROI based on ASP, resale, and volume opportunity
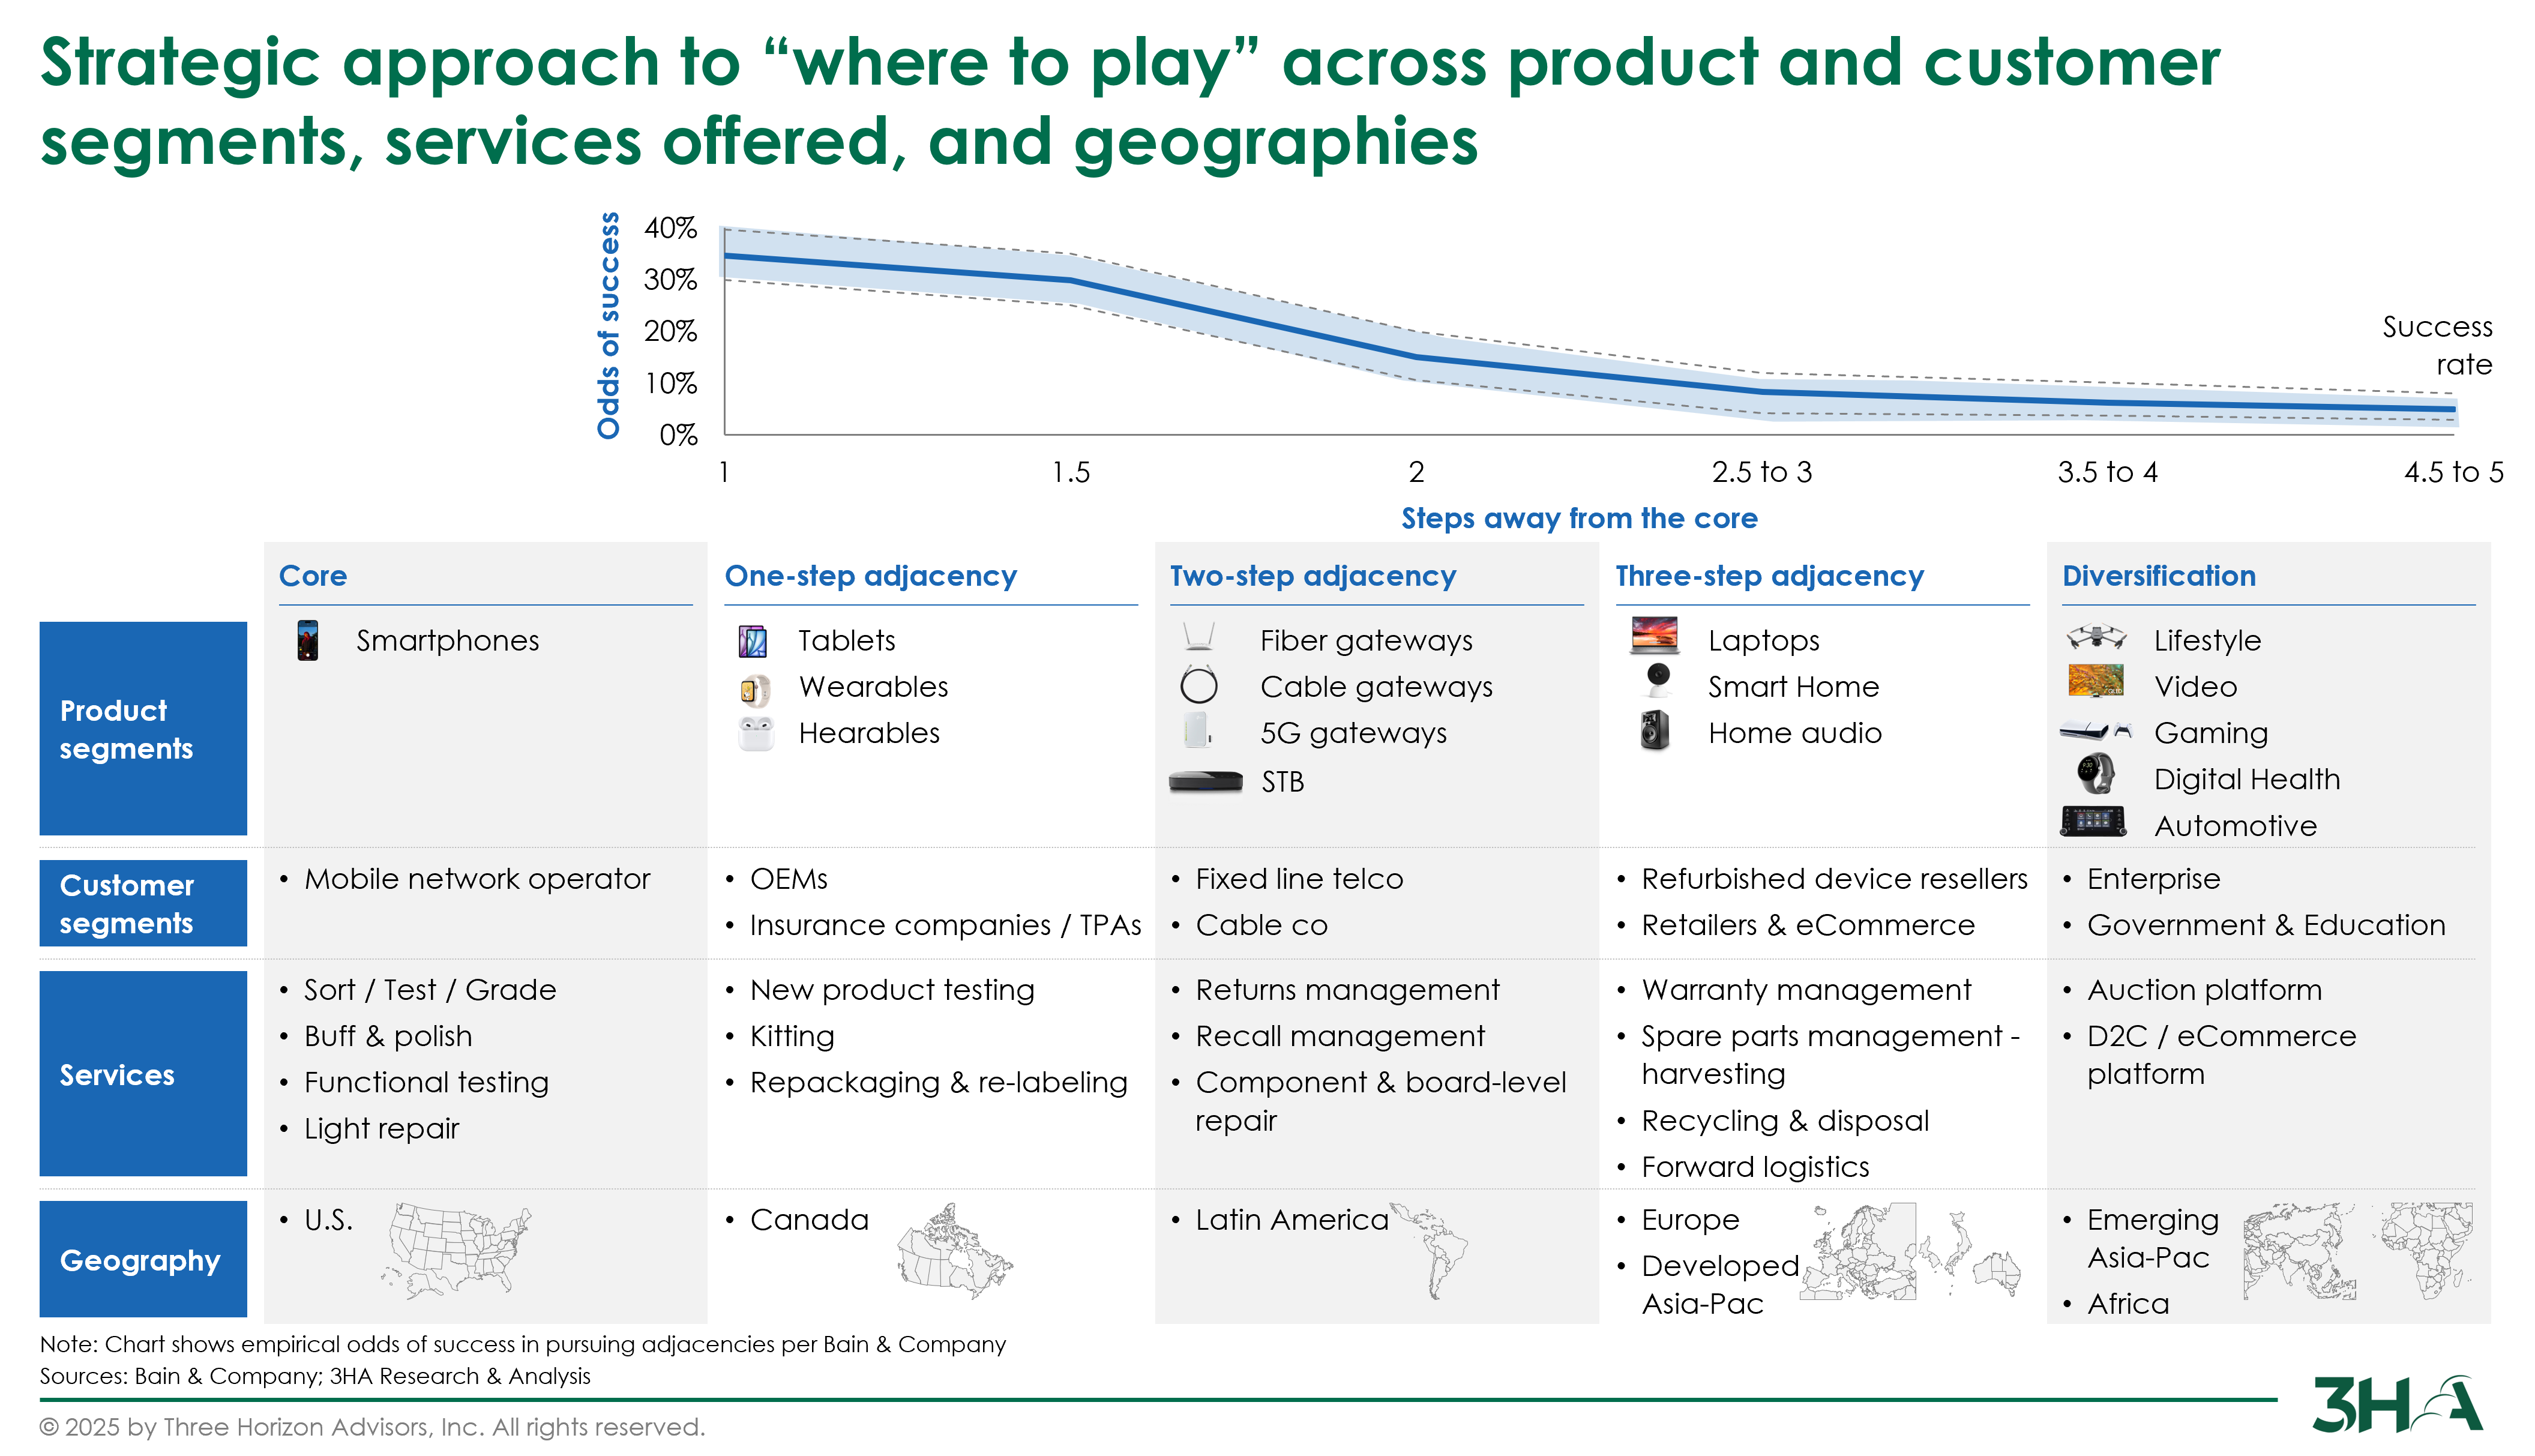
Figure 4: Repair & Refurbishment Adjacency Expansion Approach
5. Beyond Compliance: Repair as a Sustainability Strategy
Sustainability is no longer just about recycling. Repair is fast becoming a critical tool in ESG programs and corporate storytelling.
Market forces driving this shift:
🏛️ Regulatory action: Right to Repair, scope 3 tracking, carbon labeling
📈 Investor pressure: ESG ratings, sustainability-linked financing
🛠️ Customer expectations: Preference for brands with visible circularity
💼 Enterprise procurement: ESG increasingly part of RFP scoring
Leading circular programs:
- Extend product life by 1–3 years
- Create second-life streams via resale, trade-in, donation
- Reduce scope 3 emissions vs. new device manufacturing
- Include sustainability metrics in SLAs with logistics partners
Repair now touches every part of the value chain — from operations and logistics to procurement and investor relations.
If you’re navigating strategic decisions in the secondary market, whether launching new categories, entering adjacent spaces, or building an ESG story around your repair operations, we’d love to talk.