
At what price, broadband? –
The FCC released version 2 of the national broadband map in May 2023. The updated map concluded that 8.3 million U.S. homes and businesses lack access to high-speed broadband. We took a look at the alphabet soup of government programs aimed at bridging the digital divide – what they are aimed at, what they may have accomplished, and if indeed they offer a good return on taxpayer dollars. Here are 4 key observations:
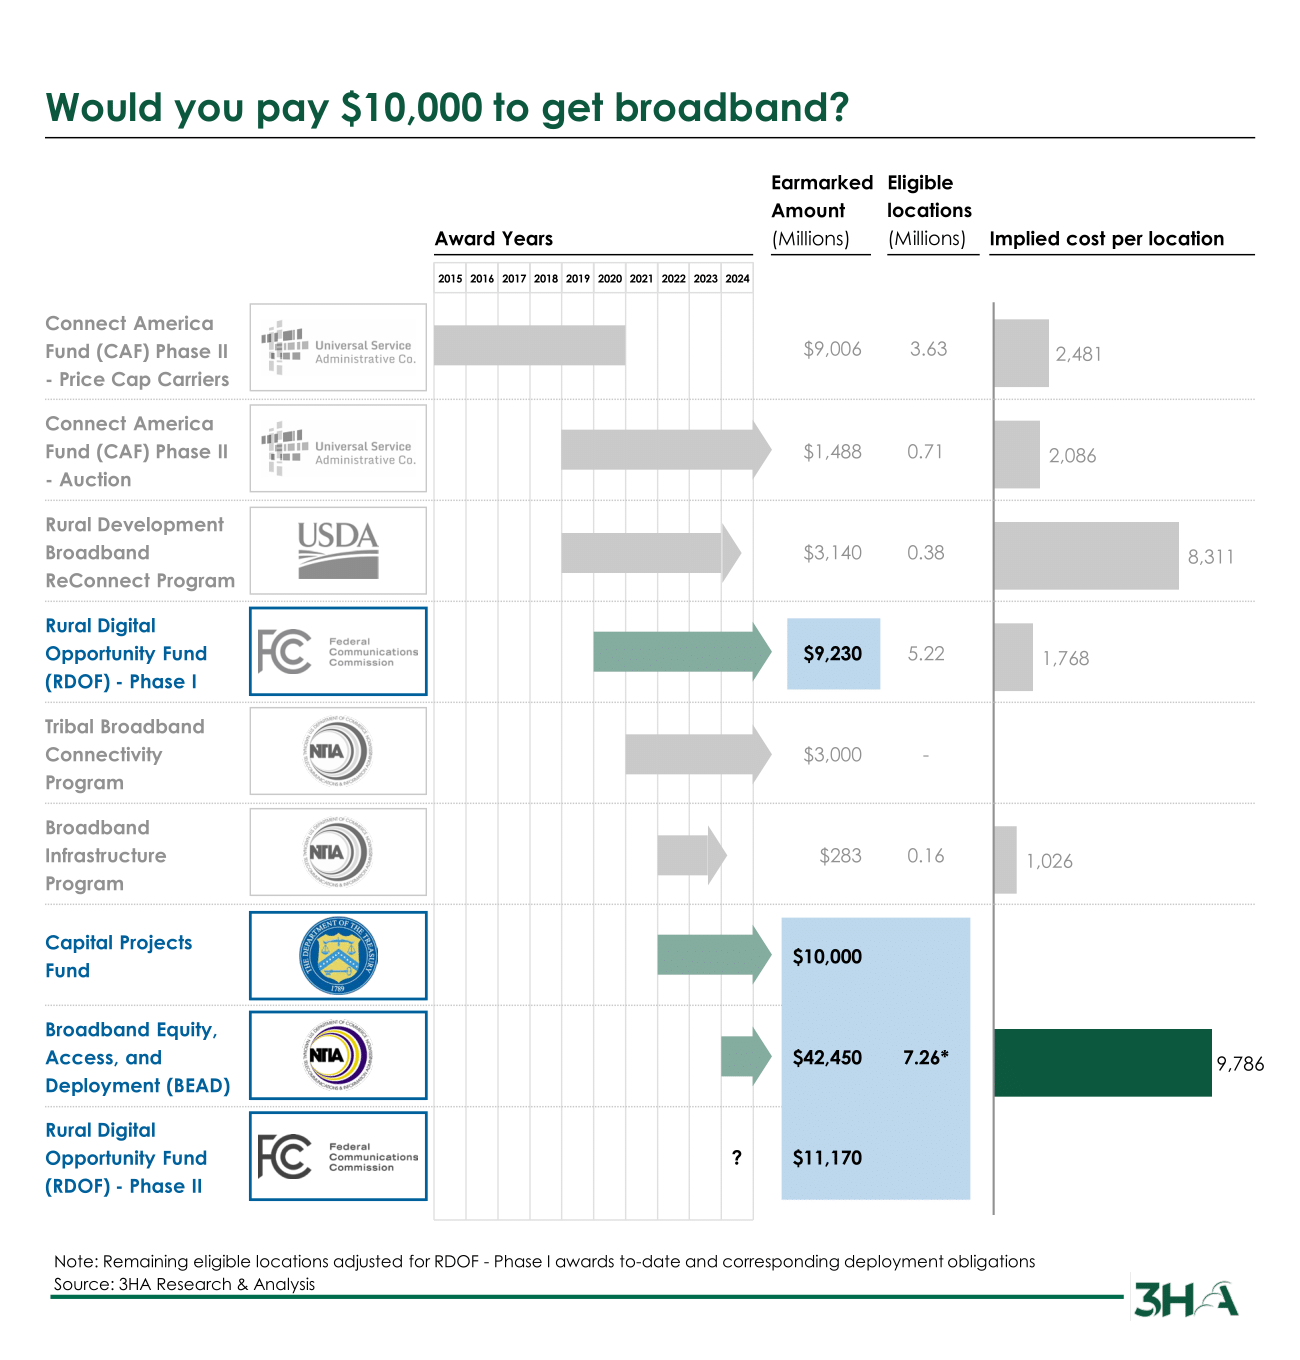
1. $90B and counting: Since the beginning of 2015, over $90B has been earmarked in an attempt to bring broadband to every single home and business
2. Sprawling administrative state: While the exhibit below does not include every single federal and none of the innumerable state and local programs, it is already a long and varied list – one can only imagine how much taxpayer $ can be saved by looking for ways to combine and administer these programs more efficiently
3. Where’s the accountability? Using this granular location based map, the authorities should seek to get the winners of these programs to give an accounting of the locations committed to and subsequently covered by their deployment
4. Take the fiber blinders off: While the Fiber Broadband Association has done a masterful job of positioning fiber as the only real alternative for next gen broadband, today and tomorrow’s use cases don’t really demand symmetrical speeds and neither do the vast majority of use cases demand multi-gig speeds. Opening up the aperture to alternative technologies including fixed wireless and satellite will get more people connected faster and cheaper
We suspect the government would have subsidized the private players in excess of $10,000 for each one of the remaining locations and yet a large portion of these will continue to be underserved. There is a need for fresh thinking – throwing more money at it is not going to solve this problem!