

Executive Summary
Artificial‑intelligence (AI) and cloud computing are reshaping the data‑center industry. Between 2024 and 2027 global data‑center capacity is forecast to grow at roughly a 16.5% compound annual growth rate (CAGR), with capacity expected to triple by 2030. Hyperscale cloud providers – a handful of global players – already account for nearly half of total installed capacity and drive two‑thirds of international bandwidth. Rapid densification, AI/ML workloads and edge computing are pushing rack power requirements from 5–10 kW/rack to 100–150 kW/rack. At the same time, grid congestion and permitting delays make power access the gating constraint, and electricity demand from AI workloads threatens to double data‑center energy consumption by 2030. This white paper examines how these forces create unprecedented demand for terminated fiber assemblies, identifies technology and market trends, and highlights opportunities for suppliers serving hyperscale and AI‑ready data centers.
Background and Scope
Our firm, a boutique strategy consultancy, was engaged by a global provider of integrated connectivity solutions to evaluate the hyperscale data‑center connectivity landscape. The client designs and manufactures integrated connectivity solutions for industrial technology, medical, telecommunications and data industries. Its products include cable assemblies, fiber‑optic and hybrid harnesses and pre‑terminated assemblies, and it operates multiple plants worldwide with the ability to ramp up production quickly. The company is backed by a family‑owned investment firm that partners with leading middle‑market businesses across manufactured products and services sectors. With a long‑duration capital base that allows for flexible investment horizons and strategic alignment, the owners sought to understand how the AI‑driven data‑center boom could enable the company to triple or quadruple its terminated‑fiber business.
Because the client had limited exposure to hyperscale and AI‑driven workloads, our mandate was to conduct a comprehensive market analysis. We reviewed public sources and industry reports, examined the competitive landscape (including opportunities for potential inorganic growth) and interviewed data‑center operators, integrators and OEMs. We also synthesized technology roadmaps to identify emerging trends. The objective was to assess market trends, customer requirements and competitive positioning, and to recommend growth strategies while respecting confidentiality around contract manufacturers and proprietary relationships.
Data‑Center Market Overview
Global Capacity and Segmentation
The data‑center industry is geographically concentrated. In Q4 2024, North America and the Asia–Pacific (APAC) region represented roughly 80% of total installed data-center capacity, while Europe/Middle East/Africa (EMEA) and Latin America accounted for the remainder. Hyperscale cloud providers – Amazon Web Services, Google, Microsoft Azure and Meta – operate the majority of this capacity, with colocation providers, enterprise/on‑premises facilities and nascent edge sites forming smaller segments. The chart below illustrates the distribution of capacity by region and segment.
Data Center Capacity by Region and Segment
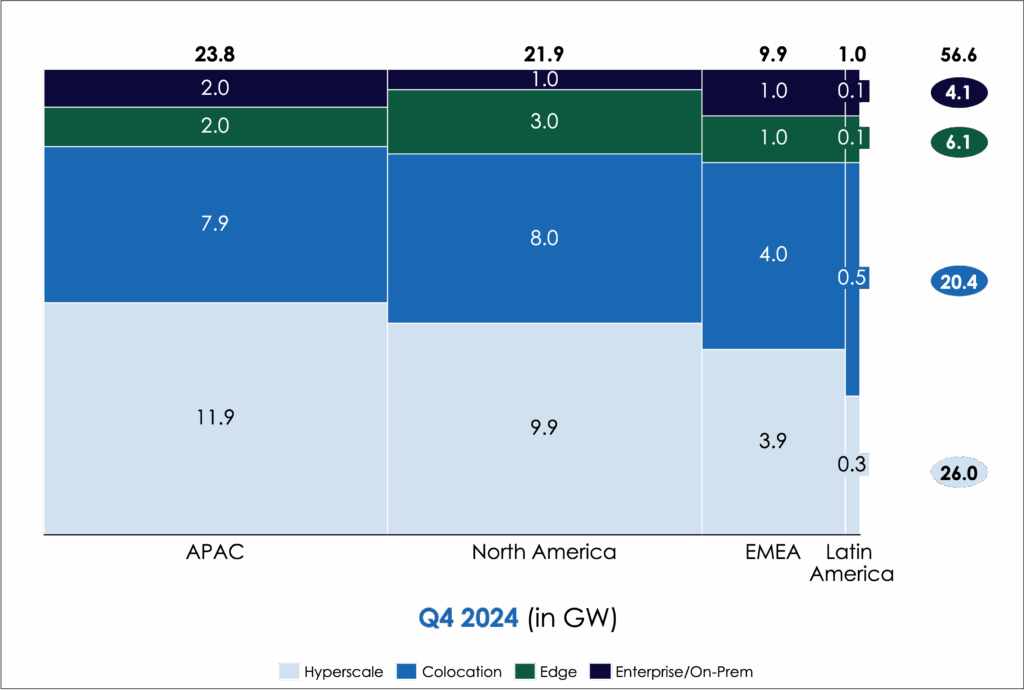
Key Observations:
- Hyperscale dominance: Hyperscale campuses account for almost half of installed capacity and are growing fastest as AI workloads proliferate.
- Regional concentration: North America and APAC hold the largest share; Latin America is small today but experiencing rapid growth as hyperscalers expand into Mexico, Chile, Colombia and Peru.
- Edge nascent but rising: Edge facilities currently represent a small portion of capacity; however, AI‑enabled applications at the network edge are driving incremental demand and will require high‑count fiber connections as they scale.
Market Growth Drivers
The following megatrends underpin growth in data‑center capacity, as captured in the figure below:
Data Center Market and Technology Trends
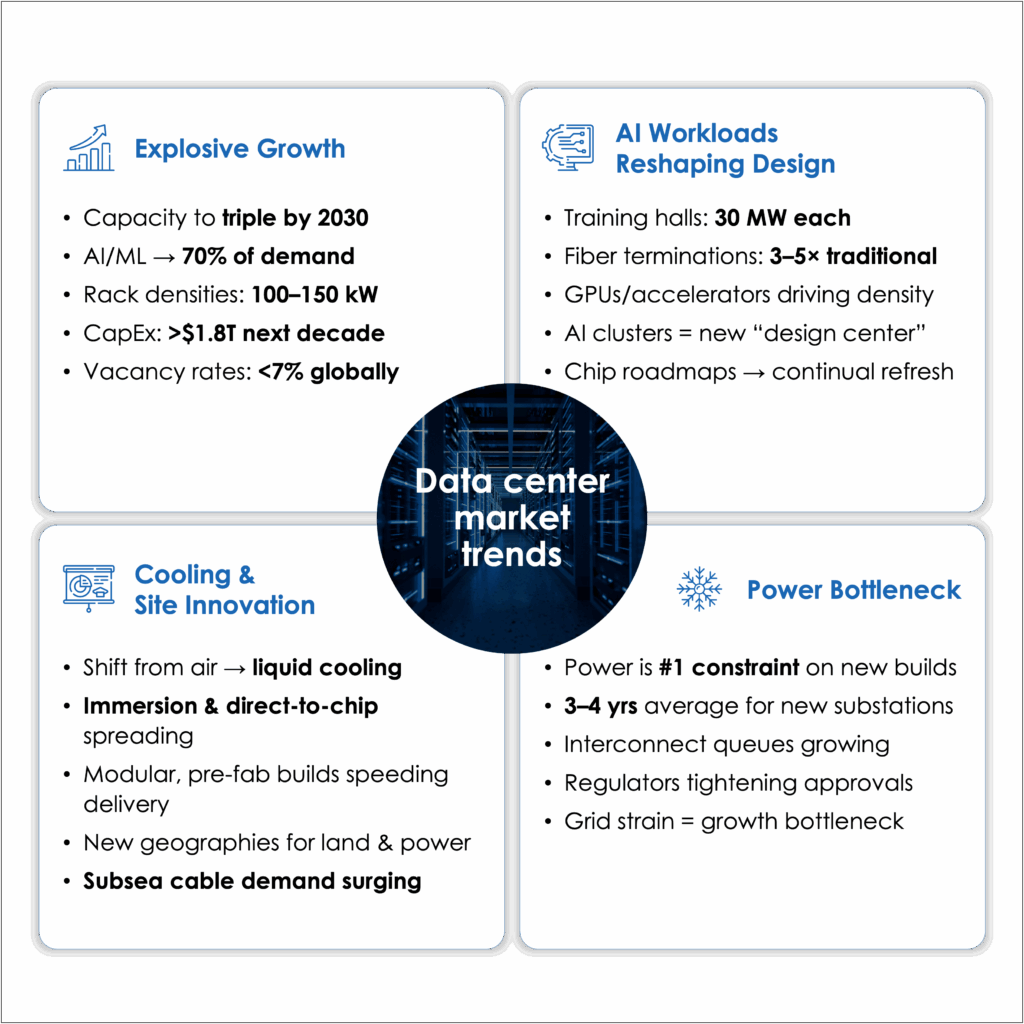
- Explosive demand from AI and cloud: AI/ML workloads are forecast to represent 70% of data‑center capacity demand by 2030. Generative AI training requires massive parallelism; a single training hall may consume 30 MW and require 3–5× the fiber terminations of a traditional compute hall. Hyperscale content providers such as Google, Facebook, Amazon and Microsoft account for roughly two‑thirds of international bandwidth, accelerating investments in long‑haul and metro dark fiber.
- High‑density facility design: Rack densities are rising from 10 kW/rack to 100–150 kW in AI clusters. Liquid and immersion cooling are rapidly becoming standard in new builds. Offsite rack integration and modular design help accelerate construction.
- Power availability as bottleneck: Grid congestion and long permitting cycles make power supply the primary constraint on new data‑center construction. Operators are pre‑leasing power, pursuing on‑site generation and signing long‑term power purchase agreements (PPAs) to secure capacity.
- Sustainability and regulation: Electricity consumption of AI data centers could reach 200 TWh by 2025. Policy interventions and investment in renewable energy sources will increasingly shape site selection and cost structures.
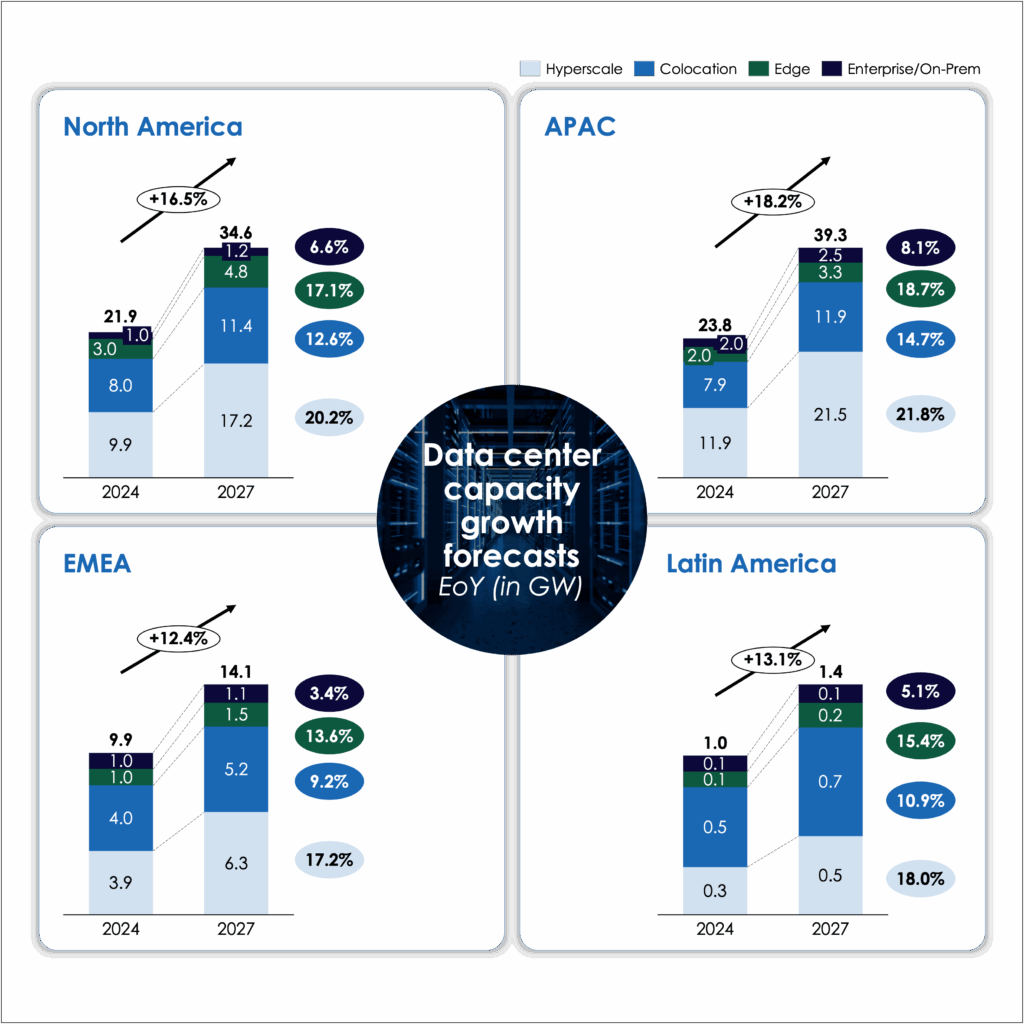
Forecasts and Regional Outlook
Data‑center capacity is projected to continue its steep ascent. The figure below shows growth forecasts by region and segment between 2024 and 2027.
Data Center Growth Forecast by Region
Related Read: AI & ML Application in Telecom
- Global CAGR of 16.5%: Capacity growth is projected to accelerate to a 16.5% CAGR between 2024 and 2027, up from 13.5% during 2021–2024.
- Hyperscale expansion (+85%): Hyperscale capacity will grow 85% over the same period, accounting for roughly 52% of global capacity by 2027.
- APAC leads: APAC is expected to grow at 18.2% CAGR through 2027, followed by North America at 16.5% and Latin America at 13.1%.
- Edge growth from a small base: Edge facilities will see robust percentage growth (10–15%) but remain a small share of overall capacity.
External research corroborates these forecasts. The Fiber Broadband Association projects that hyperscale capacity in the U.S. will triple by 2029 and that each new data center requires roughly 135 route‑miles of connectivity. Data‑center bandwidth purchases increased 330% between 2020 and 2024, with dark‑fiber purchases growing 268% on metro routes and 53% on long‑haul routes. Analysts expect the optical networking market to exceed US$10 billion by 2025.
Fiber‑Optic Connectivity Landscape
Value Chain Overview
Fiber‑optic connectivity spans a multi‑step value chain involving component design, fiber production, cable assembly, optical transceivers, network equipment, testing, deployment and operations. The diagram below summarises the key stages of this chain. Terminated fiber assemblies – the focus of our study – fall within the “Cable Assemblies & Structured Cabling” segment but are closely linked to adjacent segments. This value‑chain representation is a proprietary framework developed by our firm to capture the full ecosystem from components to operators.
Fiber Optic Connectivity Value Chain
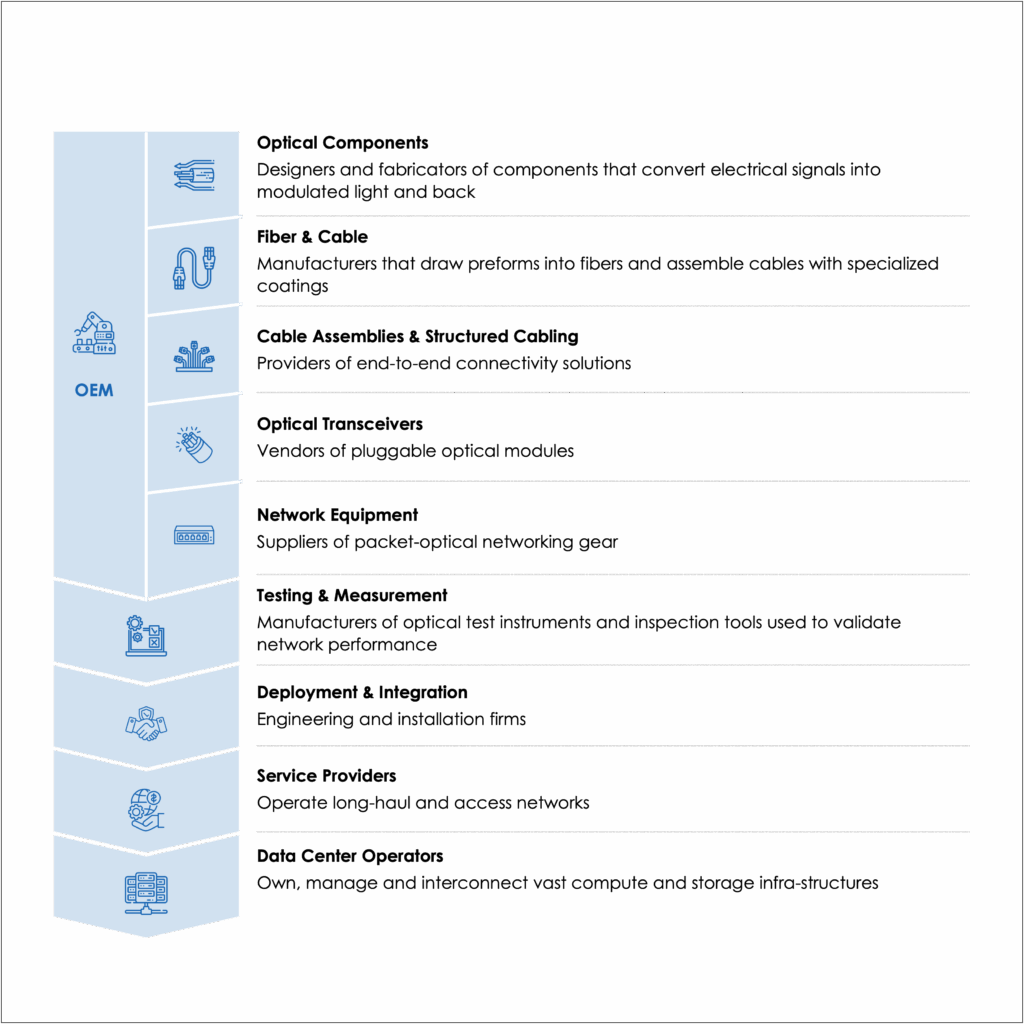
- Optical components: Semiconductor lasers, modulators and photonic integrated circuits convert electrical signals to modulated light and back.
- Fiber & cable: Draw preforms into single‑ and multimode fibers; assemble into ribbon and high‑count cables.
- Cable assemblies & structured cabling: Provide end‑to‑end connectivity solutions including pre‑terminated trunk assemblies, patch cords, connectors, adapters, cassettes and fiber‑management hardware. High‑density pre‑terminated trunk systems and modular assemblies are essential for AI/ML clusters.
- Optical transceivers: QSFP/QSFP‑DD, OSFP and coherent pluggable modules enable 400 Gb/s to 800 Gb/s links; pluggable optics are expected to grow to a US$27 billion market by 2027.
- Network equipment: Ethernet switches, packet‑optical transport platforms and routers provide high‑throughput switching and coherent transport; open line systems and disaggregation enable multi‑vendor networks.
- Testing & measurement: Optical time‑domain reflectometers, power meters, spectrum analysers and fusion splicers validate network performance.
- Deployment & integration: Engineering firms and contractors handle design, installation, splicing and termination; system integrators and IT service providers deliver turnkey solutions.
- Service providers: Telecom carriers, internet service providers (ISPs) and dark‑fiber operators operate long‑haul and metro access networks.
- Data‑center operators: Public cloud providers, colocation companies and edge data‑center operators own, manage and interconnect compute and storage infrastructure.
Market and Technology Trends
Four major themes drive the evolution of fiber‑optic connectivity for AI and hyperscale data centers:
- Demand drivers & market growth: The combination of AI/ML workloads, 5G deployments and remote/hybrid work is fuelling unprecedented traffic growth. Hyperscale content providers now account for roughly two‑thirds of global international bandwidth. The global structured cabling market was valued at ~US$12.4 billion in 2024 and is projected to exceed US$26 billion by 2033 (8.5% CAGR).
- Technology & capacity innovation: Successive optical upgrades (e.g., from 400 G to 800 G) provide only marginal spectral efficiency improvements. Coherent pluggable optics and wider C + L‑band spectrum will drive capacity growth, while research into hollow‑core fiber and photonic integrated circuits continues. High‑density, pre‑terminated trunk systems and modular assemblies are essential to meet the speed and space constraints of AI/ML clusters.
- Network architecture & disaggregation: Carriers are adopting open line systems and disaggregated architectures to scale capacity and reduce vendor lock‑in. Structured‑cabling providers are expanding into design, installation and ongoing support services.
- Energy & sustainability: AI‑driven compute threatens to double data‑center electricity usage to ~1,065 TWh by 2030. Energy‑efficient cabling solutions (low‑loss fibers, high‑density connectors) and greener power sources are emerging procurement criteria. Land and power constraints are already triggering moratoria on new builds in certain regions.
External sources reinforce these themes: generative‑AI data centers require over 10 × more optical fiber than traditional networks, and the adoption of 400/800 G pluggable optics and IP‑over‑DWDM architectures is accelerating. Analysts expect international bandwidth to grow at 26% CAGR through 2031 and note that 39 new hyperscale data centers and 35 new cloud regions are planned for 2025 alone.
Customer Priorities and Demand Mechanics
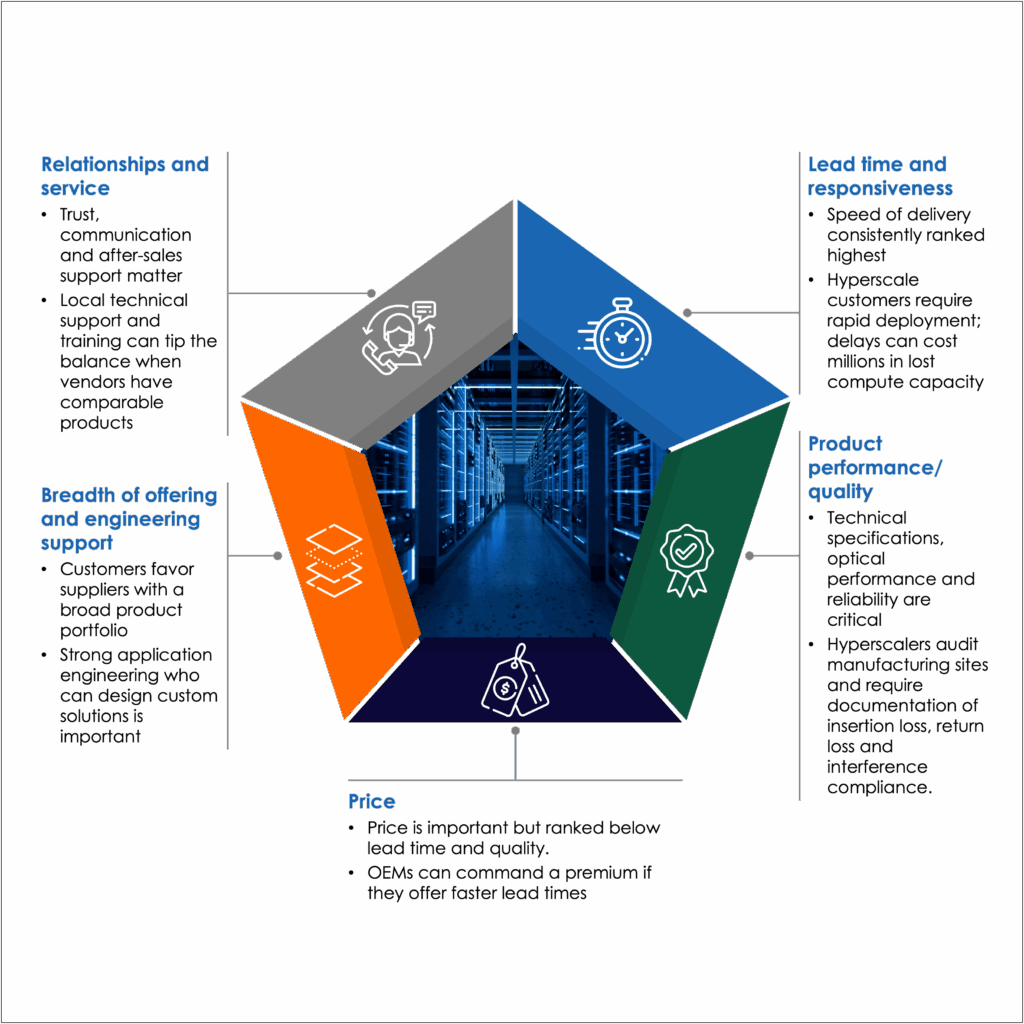
Lead Time, Quality and Price
Hyperscale and cloud customers rank lead time and responsiveness above all other factors when procuring terminated fiber assemblies. Speed of delivery consistently emerges as the top driver – hyperscalers will pay a premium if suppliers can ship custom MPO trunks within weeks. Technical specifications, optical performance and reliability are non‑negotiable; hyperscalers audit manufacturing sites and require documentation of insertion loss, return loss and interference compliance. Price is secondary: buyers are willing to pay more for faster lead times and high performance, especially for high‑fiber‑count MPO assemblies. Customers also value a broad product offering, strong application engineering and local technical support.
The graphic below summarises these priorities.
Explosive Data Center Growth Elevates Lead Time Above All Else
Structured Demand Split
Hyperscale data‑center customers classify demand into two broad buckets:
- Pre‑planned orders with a 4‑ to 12‑week lead time (typical for base‑build projects).
- Short‑lead‑time orders that require shipment in days or weeks (for unanticipated equipment installations or capacity upgrades).
High‑fiber‑count MPO trunk assemblies are often custom‑length to fit rack layouts precisely; approximately 80% of MPO/MTP orders are custom, whereas LC jumper business is roughly 75% standard lengths. Customers maintain an approved vendor list of 2–3 OEMs, but the actual allocation of orders is heavily influenced by system integrators, installers and contractors. Dual‑sourcing is standard practice to mitigate supply‑chain risk; orders may be split evenly across OEMs or shifted depending on inventory availability. Local integrators and distributors often decide which product is purchased.
Pricing and Regional Considerations
Pricing is generally set by region rather than by manufacturing location. End‑customers typically receive a single price for a given region, even if the product is produced elsewhere. Any premium is directly linked to faster lead times. Custom MPO trunks with short delivery windows justify near‑shoring or regional manufacturing, whereas commodity LC patch cords with longer tolerance for lead time tend to be produced in lower‑cost geographies. Tier‑1 and tier‑2 OEMs are increasingly moving to a regional manufacturing and fulfillment model to balance speed, tariffs and inventory carrying costs.
Capacity and Scalability
Industry Capacity Constraints
Experts report that the fiber‑optic connectivity industry is capacity‑constrained due to surging demand from AI and cloud expansion. Scaling fiber production is capital‑intensive: building a new draw tower or connector production line can take two years, and qualification periods further delay output. The most acute bottlenecks are fiber drawing and connector production, not assembly. Many fiber components (e.g., ferrules, ferrule holes) are produced by a handful of suppliers; capacity constraints at these vendors ripple through the supply chain.
Assembly Scalability
Scaling assembly capacity is relatively straightforward: expansion involves adding tables, chairs, polishing machines and trained technicians. An interferometer costs $40,000–50,000, and polishing machines cost $12,000–15,000; these capital expenditures are manageable. The main challenge is labor – training assemblers to meet stringent quality standards takes six to eight weeks, and the work is repetitive and demanding. Companies therefore weigh the benefits of near‑shoring or automation against labor availability and costs.
Strategic Considerations for Fiber‑Connectivity Providers
- ⚡ Strengthen lead‑time advantage: Hyperscale customers prioritise speed above all else. Suppliers should invest in regional manufacturing and maintain buffer inventory of high‑fiber‑count MPO components to offer two‑week or faster turnaround times. Partnerships with integrators and distributors help ensure inclusion on approved vendor lists and support rapid response to urgent orders.
- 📦 Expand product portfolio: High‑density pre‑terminated trunk systems, modular plug‑and‑play assemblies and mixed‑media (fiber/copper) harnesses are experiencing healthy growth. Providers can differentiate themselves by bundling cabling hardware with design, installation and ongoing support services, enabling customers to deploy AI clusters quickly and reliably.
- 🧠 Invest in technology: As pluggable optics transition from 400 G to 800 G and beyond, companies should align connector and cable designs with coherent modules. Collaborating with transceiver vendors on connector roadmaps (e.g., MMC, SN/MDC) positions suppliers for next‑generation architectures and helps anticipate emerging standards.
- 🌱 Leverage sustainability: Energy‑efficient cabling—such as low‑attenuation fibers and high‑density connectors that reduce cooling loads—along with recyclable packaging and circular‑economy practices can become key procurement criteria as ESG considerations grow. Demonstrating improved thermal performance will resonate with customers facing power and cooling constraints.
- 🔄 Monitor adjacent segments: While details of contract manufacturing remain sensitive, fiber‑connectivity providers can explore adjacent opportunities in optical transceivers, packet‑optical equipment, testing systems or systems integration. Many tier‑two cable‑assembly vendors supply multiple segments; vertical integration, strategic partnerships or acquisitions could broaden the addressable market and create synergies.
Conclusion
AI and cloud workloads are propelling an unprecedented boom in data‑center construction and capacity expansion. Hyperscale providers dominate capacity and account for most of the bandwidth growth, pushing rack densities into the 100–150 kW range and straining power grids. Fiber‑optic connectivity is the backbone of this infrastructure: high‑density, pre‑terminated trunk systems and modular assemblies are essential to meet deployment speed, power and space constraints. Suppliers who can deliver custom, high‑performance assemblies with rapid lead times and provide engineering support will command a premium in this fast‑growing market. By understanding demand mechanics, investing in technology and sustainability, and expanding into adjacent segments, fiber‑connectivity providers have the opportunity to scale their businesses three‑ to five‑fold over the next few years.
Banner pic credit: freepik.com